
Demographics Table 14.1.1: Complete Step-by-Step SAS Workflow
Build the quintessential clinical trial summary table with continuous and categorical variables.
Direct Answer / Executive Definition
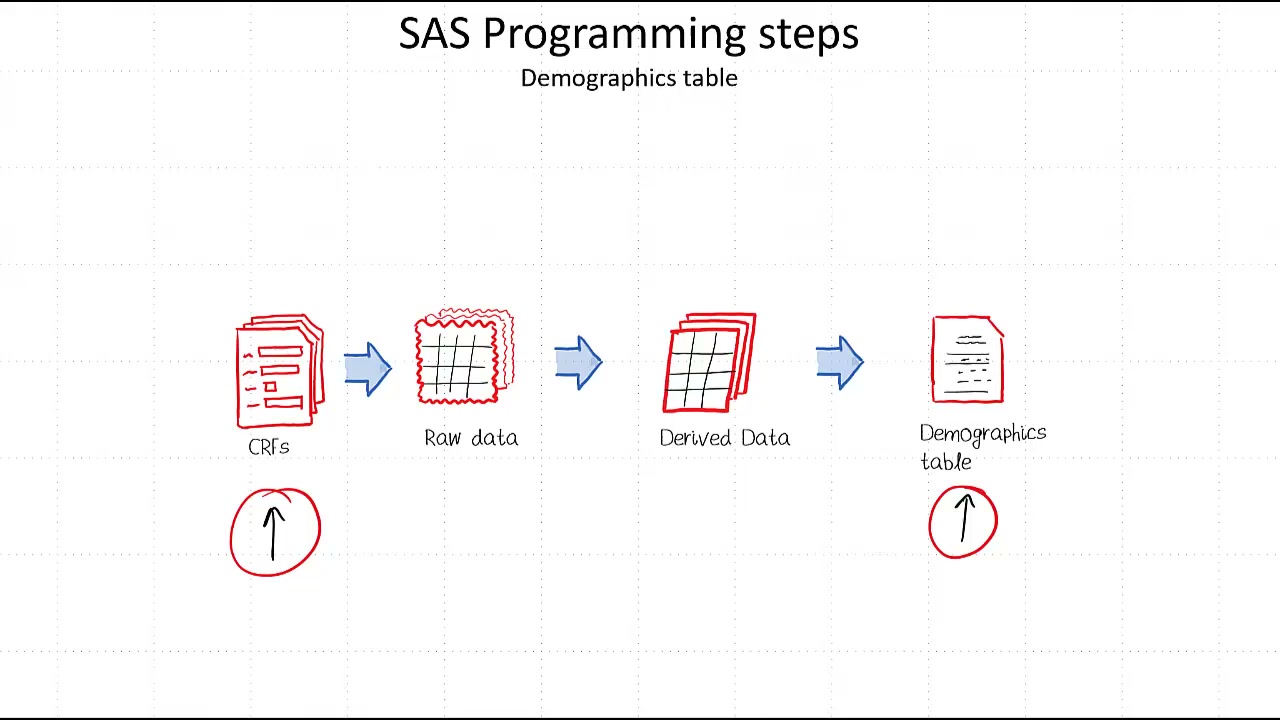
Table 14.1.1 (Demographic and Baseline Characteristics) is the first and most scrutinized summary table in any Clinical Study Report (CSR). It summarizes continuous variables (Age, Weight, BMI via Mean, SD, Median, Min, Max) using PROC MEANS and categorical variables (Sex, Race, Ethnicity via counts and percentages) using PROC FREQ across treatment arms.
Why Table 14.1.1 Precision Rules Matter in FDA Reviews & Technical Interviews
Table 14.1.1 is standard across all FDA submissions and serves as the benchmark test in clinical SAS programmer technical interviews.
Standard Syntax, Derivation & Framework Pattern
/* Step 1: Continuous Summary for Age using PROC MEANS */
PROC MEANS DATA=adam.adsl NOPRINT;
    WHERE SAFFL='Y';
    CLASS TRT01PN;
    VAR AGE;
    OUTPUT OUT=work.age_stats
        N=n MEAN=mean STD=std MEDIAN=median MIN=min MAX=max;
RUN;

/* Step 2: Categorical Summary for Sex using PROC FREQ */
PROC FREQ DATA=adam.adsl NOPRINT;
    WHERE SAFFL='Y';
    TABLES TRT01PN * SEX / OUT=work.sex_counts OUTPCT;
RUN;

/* Step 3: Transpose, Format Precision, and Stack into Final Shell */
Core Rules
- Continuous variables require N, Mean, Standard Deviation (SD), Median, Minimum, and Maximum.
- Decimal precision rule (n+1): Mean and Median are reported to 1 extra decimal place than raw data; SD is reported to 2 extra decimal places; Min/Max retain raw precision.
- Categorical variables are reported as count and percentage: n (xx.x%). Percentages are calculated against the treatment arm total population (N from ADSL).
- Render final layout to RTF or PDF using PROC REPORT with proper column headers and title/footnote specs.
Related Architectural Concepts & Next Steps
Deepen your mastery with connected topics across our curriculum and knowledge hubs.
Frequently Asked Questions (FAQ)
What is the decimal precision rule in Table 14.1.1?
The standard pharma convention is: raw precision for Min/Max, raw + 1 decimal place for Mean and Median, and raw + 2 decimal places for Standard Deviation (SD).
What is the denominator for percentage calculations in Table 14.1.1?
The denominator is the total number of subjects in the specified analysis population (e.g. Safety population N in each treatment group column), derived from ADSL.
Want complete video breakdowns & exercises?
Explore full step-by-step masterclass training in Clinical SAS Programming & Clinical Trials.