

A flat, 74-row risk register spreadsheet is not a risk management strategy—it is uncurated noise. Treating all project risks as an unsorted list blinds project sponsors to Risk Concentration, where 70% of total financial exposure clusters in just two external supplier contracts while teams waste mitigation budgets tinkering with minor software bugs. The Risk Breakdown Structure (RBS) decomposes uncertainties hierarchically by operational source (Technical, Project Management, Organizational, External). In PMP® and enterprise governance, the RBS serves as an active prompt list during Identify Risks, assigns logical domain ownership, and aggregates Probability × Impact scores to direct contingency reserves to the true vulnerabilities of the project.
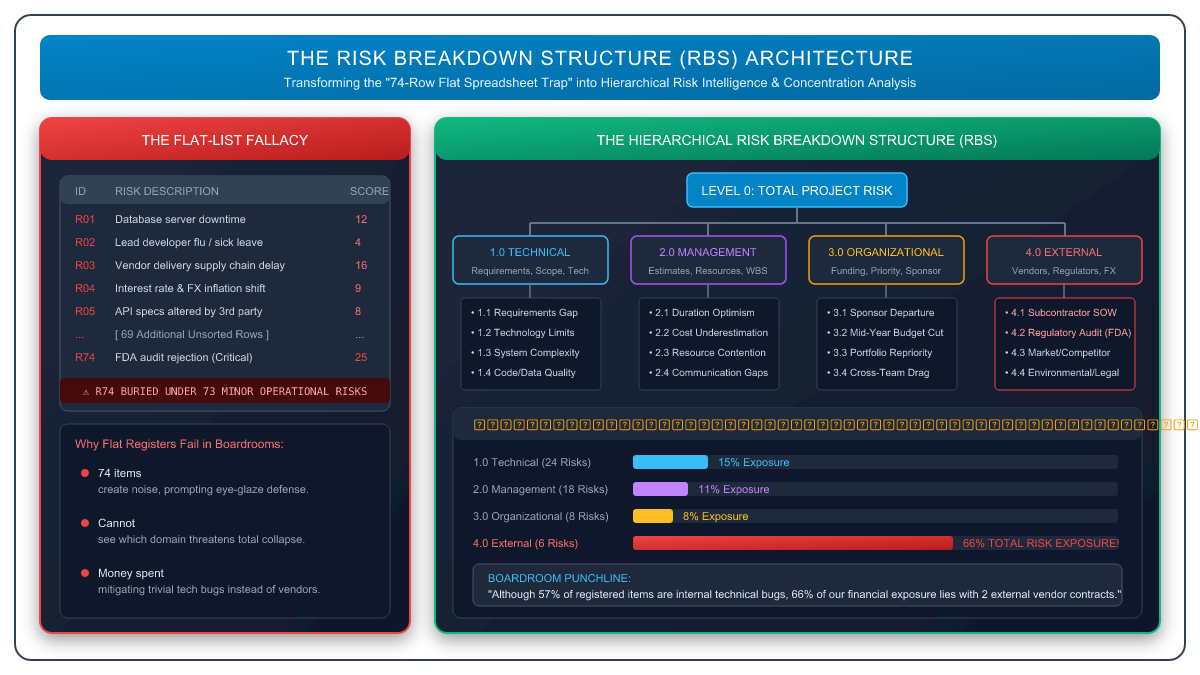
Figure 1: Architectural Comparison — The Flat-List Fallacy (Left) vs. The 4-Tier Hierarchical Risk Breakdown Structure & Risk Concentration Roll-Up (Right).
1. The 74-Row Spreadsheet Fallacy #
Imagine walking into an executive steering committee alignment meeting. You want to demonstrate that you are in total command of your multi-million-dollar digital transformation program. To prove thoroughness, you open your screen and display your risk register: a chronological, flat spreadsheet containing 74 individual risks.
You have recorded everything with meticulous detail:
R01:Database server downtime during weekend migration.R02:Lead UI developer catches the flu during sprint 4.R03:Third-party payment gateway experiences API latency.R04:Federal Reserve interest rate shift increases cloud infrastructure cost.R74:Regulatory audit rejects data lineage, halting European launch.
Instead of admiring your thoroughness, the executive sponsor’s eyes glaze over. The room turns defensive. Within ten minutes, an executive asks an aggressive question about a trivial row, the meeting gets derailed, and leadership leaves with a lingering doubt: "This project manager is running a chaotic game of whack-a-mole. They don't know where the project is actually vulnerable."
Why? Because a flat list treats all uncertainties as identical line items. When R74 (a critical regulatory audit failure that could cancel the project) is visually buried under 73 routine operational hiccups, you haven't built a risk management strategy. You have built a distracting wall of administrative noise.
2. The Architecture of a Risk Breakdown Structure (RBS) #
To transition from reactive fire-fighting to strategic governance, mature project organizations use the Risk Breakdown Structure (RBS).
Just as a Work Breakdown Structure (WBS) breaks down project deliverables into work packages, and a Resource Breakdown Structure categorizes human and physical capital, the RBS hierarchically organizes potential sources of project risk.
• The Risk Breakdown Structure (RBS) categorizes the structural sources of uncertainty (e.g., 4.1 Subcontractor SOW Contracts).
• The Risk Register documents specific, situational events that may occur (e.g., "Vendor Acme fails to deliver the SDK by March 15").
In the standard PMBOK framework, an RBS begins at Level 0 (Total Project Risk) and decomposes into Level 1 categories and Level 2 subcategories:
3. The 4 Standard Level-1 RBS Categories #
While every enterprise can tailor its RBS to its specific industry, high-performing engineering and PMP delivery environments standardize on four primary Level 1 branches:
1.0 Technical Risks #
Uncertainties relating to product architecture, software quality, performance, and technical limits.
- 1.1 Requirements ambiguity & shifting specs
- 1.2 Legacy database & technology limits
- 1.3 Microservice architectural complexity
- 1.4 Performance, latency, & data integrity
2.0 Project Management Risks #
Uncertainties originating from planning mechanics, estimations, and execution discipline.
- 2.1 Optimistic task estimation & student syndrome
- 2.2 Incomplete WBS & sequencing logic
- 2.3 Key person dependency & paired engineering
- 2.4 Stakeholder communication & alignment gaps
3.0 Organizational Risks #
Internal corporate dynamics, cross-functional friction, and funding stability.
- 3.1 Executive sponsor departure / turnover
- 3.2 Mid-cycle portfolio budget reallocations
- 3.3 Conflicting departmental priorities
- 3.4 Culture resistance & change management
4.0 External Risks #
Uncontrollable market, vendor, legal, and regulatory conditions.
- 4.1 Third-party vendor SOW breaches & delays
- 4.2 Regulatory audits (FDA, EMA, 21 CFR Part 11)
- 4.3 Competitor product announcements & FX shifts
- 4.4 Supply chain logistics & environmental disruption
4. The Mathematical Superpower: Uncovering "Risk Concentration" #
The true operational magic of the RBS happens during Perform Qualitative Risk Analysis.
When you evaluate each risk in your register, you assign a Probability score (1–5) and an Impact score (1–5), yielding an individual Risk Score = Probability × Impact (ranging from 1 to 25).
In a flat spreadsheet, those scores stay isolated on individual lines. But when you map every risk to an RBS category code (e.g., 1.2 for Technology or 4.1 for Subcontractors), you can aggregate the risk scores across each branch:
Category Risk Exposure = Σ (Probability × Impact) for all risks in Category
// Example 74-Risk Enterprise Audit:
• 1.0 Technical (24 Risks): Σ Score = 96 (15% of Project Exposure)
• 2.0 Project Management (18 Risks): Σ Score = 72 (11% of Project Exposure)
• 3.0 Organizational (8 Risks): Σ Score = 48 (8% of Project Exposure)
• 4.0 External (6 Risks): Σ Score = 420 (66% OF PROJECT EXPOSURE!)
Look at that mathematical reality:
Over 57% of the lines in the project manager’s spreadsheet belonged to internal technical concerns. In a flat register, the team naturally spends 80% of their risk meetings debating database indexes and test scripts.
Yet the RBS proves that 66% of the project’s total vulnerability was concentrated in just two external subcontractor contracts and a pending regulatory validation.
Armed with this roll-up, your executive presentation transforms completely. Instead of reciting 74 items, you state:
"Sponsor, our 74 risks collapse into four operational categories. While our engineering team has 24 minor software bugs under active mitigation, 66% of our financial exposure lies with two external vendors. Here is our paired-engineering defense to mitigate that specific concentration."
That is how an executive project manager earns trust.
5. The Prompt List Advantage: Eliminating Blind Spots #
When project managers conduct Identify Risks sessions, the common mistake is asking the team an unconstrained question: "What could go wrong on this project?"
Psychological bias dictates the answers: developers identify code bugs; QA engineers identify broken test environments; accountants identify budget line items. Everyone identifies risks in their personal comfort zone. The project remains completely blind to external, legal, and operational risks.
In the PMBOK framework, the RBS serves as an active Prompt List. You walk the team down the structure branch by branch:
- "Let's spend 15 minutes exclusively on Branch 1.1: Requirements ambiguity."
- "Now let's switch to Branch 3.1: Upstream project dependencies and shared infrastructure."
- "Now let's examine Branch 4.2: What regulatory shifts in GDPR or 21 CFR Part 11 could impact us?"
Pairing the RBS with macroeconomic prompt frameworks like PESTLE (Political, Economic, Social, Technological, Legal, Environmental) or TECOP (Technical, Environmental, Commercial, Operational, Political) ensures zero blind spots slip through.
6. PMP Exam Rules & Situational Question Mechanics #
If you are preparing for the PMP® Exam, PMI regularly tests your understanding of where the RBS fits in the project lifecycle:
Core PMP Exam Takeaways: #
- Created in Plan Risk Management: The RBS is an output of the Plan Risk Management process and forms an integral section of the Risk Management Plan. It is NOT created in Identify Risks.
- Used as a Tool in Identify Risks: The RBS is used as a Prompt List tool/technique to structure brainstorming sessions.
- Used in Qualitative Risk Analysis: The RBS is used for Risk Categorization, grouping risks to determine which departments or vendors require targeted response planning.
- Sources vs. Events: If an exam question asks where single risk events are recorded, the answer is always the Risk Register. If it asks where high-level categories of risk sources are documented, the answer is the Risk Breakdown Structure (RBS).
Risk Breakdown Structure (RBS) & Risk Concentration Guide #
Explore our authoritative encyclopedic guide on RBS architecture, PESTLE/TECOP prompt lists, and PMP exam situational decision rubrics.
Lesson 7.06: Perform Qualitative Risk Analysis & The Risk Register #
Master probability and impact matrices, risk scoring rules, and how to structure enterprise risk registers to protect budgets and schedules.